
2026 Global Outsourcing & Remote Talent Statistics Tracker
Last Updated: March 2026
The 2026 Global Outsourcing & Remote Talent Statistics Tracker gathers the latest data on global outsourcing, offshore hiring, remote talent statistics, remote work trends, and AI-powered workforce adoption. It highlights key statistics on outsourcing market growth, offshore salary comparisons, remote workforce productivity, and global talent distribution, providing a clear snapshot of workforce trends shaping 2026.
Table of Contents
Outsourcing Market Size & Growth
- The Global Outsourcing Market has reached approximately $1.09 trillion in 2025, and is expected to reach $1.48 trillion by 2030.
- 2 out of 3 companies in the U.S. are already outsourcing in at least 1 department.
- By 2022, 68% of large U.S. companies outsourced at least one business function; 80% of small businesses outsourced part of their operations. Currently, 66% of U.S. companies outsource at least one department or process.
- 28% of U.S. skilled knowledge workers now work as freelancers or independent professionals.
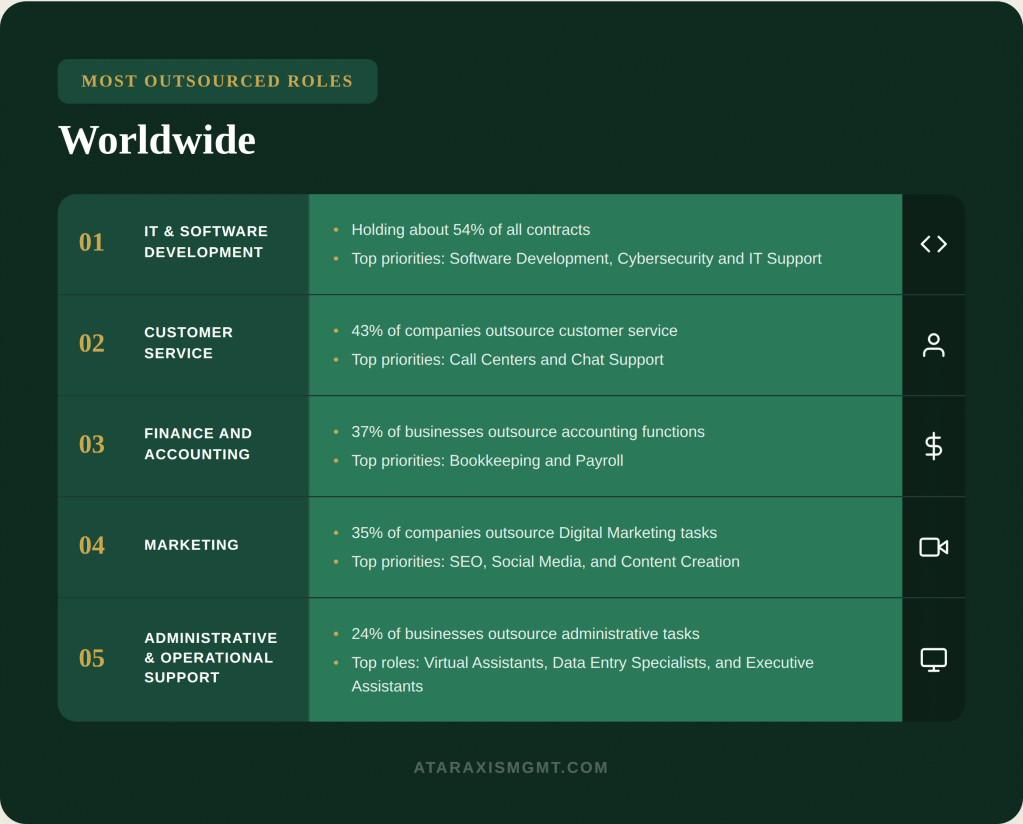
- IT services dominate outsourced work, followed by administrative, operational, and digital marketing roles.
Feel free to share this infographic! Just please credit us with a link. You can re-upload the image or copy the embed code below:
<a href="https://ataraxismgmt.com/global-outsourcing-remote-talent-statistics-tracker/"><img src="https://09932210.delivery.rocketcdn.me/wp-content/uploads/2026/03/Most-outsourced-roles.png.webp" alt="Most outsourced roles" style="width: auto; height: auto; max-width: 100%; border: none;"></a><p>Source: <a href="https://ataraxismgmt.com/global-outsourcing-remote-talent-statistics-tracker/">Ataraxis Management Inc.</a></p>
Time-to-Hire Comparison
Traditional Hiring:
- High-volume, frontline roles: 20–35 days
- Professional/individual contributor roles: 35–50 days
- Senior leadership & niche technical roles: 60–90+ days
- Average: 48+ days
Offshore Hiring with Ataraxis:
- Typically, 14 days from sourcing to placement, due to efficient vetting and a global candidate pool.

Feel free to share this infographic! Just please credit us with a link. You can re-upload the image or copy the embed code below:
<a href="https://ataraxismgmt.com/global-outsourcing-remote-talent-statistics-tracker/"><img src="https://09932210.delivery.rocketcdn.me/wp-content/uploads/2026/03/Traditional-vs-Ataraxis-Hiring-2.png.webp" alt="Traditional vs Ataraxis Hiring" style="width: auto; height: auto; max-width: 100%; border: none;"></a><p>Source: <a href="https://ataraxismgmt.com/global-outsourcing-remote-talent-statistics-tracker/">Ataraxis Management Inc.</a></p>
U.S. vs Offshore Salary Comparisons
| Country | Gross Annual Wage |
|---|---|
| U.S. | $70,627 |
| Philippines | $3,660 |
| Malaysia | $11,280 |
| India | $5,400 |
| Chile | $8,570 |
| South Africa | $17,965 |
| Nigeria | $2,650 |
| Peru | $7,174 |
| Indonesia | $3,296 |
| Argentina | $17,416 |
| Romania | $13,020 |

Feel free to share this infographic! Just please credit us with a link. You can re-upload the image or copy the embed code below:
<a href="https://ataraxismgmt.com/global-outsourcing-remote-talent-statistics-tracker/"><img src="https://09932210.delivery.rocketcdn.me/wp-content/uploads/2026/03/US-vs-offshore-wages-2.png.webp" alt="US vs offshore wages" style="width: auto; height: auto; max-width: 100%; border: none;"></a><p>Source: <a href="https://ataraxismgmt.com/global-outsourcing-remote-talent-statistics-tracker/">Ataraxis Management Inc.</a></p>
Top Outsourcing Destinations 2026
By Region:
- LATAM: Chile, Peru, Argentina, Dominican Republic, Brazil
- Asia: Philippines, Malaysia, India, Indonesia, Pakistan
- Africa: South Africa, Nigeria, Kenya, Egypt, Ghana
- Europe: Romania, Poland, Hungary, Bulgaria, Czech Republic
Source: Global Outsourcing Talent Index
Fastest-Growing Countries: Philippines, India, South Africa, Peru, Argentina, Kenya, Dominican Republic, Brazil, Poland, Egypt (Internal Data)
Best by English Proficiency: South Africa, Romania, Poland, Philippines, Malaysia, Nigeria, Argentina, Kenya, Ghana, Hungary
Top Roles Outsourced: software development & IT, healthcare, customer service, finance & accounting, digital marketing
Ataraxis’ Top 10 Picks: South Africa, Kenya, Philippines, India, Peru, Argentina, Egypt, Brazil, Colombia, Poland
Hybrid Workforce & AI Adoption
- 17% of U.S. companies were using AI in operations as of late 2025–2026; 30% among large firms.
- 75% of generative AI productivity impact occurs in customer operations, marketing & sales, software engineering, and R&D.
- Generative AI could contribute $2.6–$4.4 trillion annually to global productivity.
- AI adoption may increase global labor productivity growth by 0.1–0.6 percentage points annually through 2040.
High AI-Exposure Jobs:
- Computer programmers: ~75%
- Data entry keyers: ~67%
- Customer service representatives: 65–70%
- Financial analysts: ~55%
- Writers: ~48%
- Paralegals: ~42%
- QA engineers: ~40%
- Data scientists: ~38%
- Bookkeeping clerks: ~36%
Source: Pooya Golchian
Low-Exposure Jobs:
Construction workers, mechanics, installation/maintenance, protective services, personal care, healthcare support (~12–29% AI task exposure).

Feel free to share this infographic! Just please credit us with a link. You can re-upload the image or copy the embed code below:
<a href="https://ataraxismgmt.com/global-outsourcing-remote-talent-statistics-tracker/"><img src="https://09932210.delivery.rocketcdn.me/wp-content/uploads/2026/03/The-best-destinations-for-AI-Roles.png.webp" alt="The best destinations for AI Roles" style="width: auto; height: auto; max-width: 100%; border: none;"></a><p>Source: <a href="https://ataraxismgmt.com/global-outsourcing-remote-talent-statistics-tracker/">Ataraxis Management Inc.</a></p>
Remote Talent Statistics 2026
- 40% of companies have hired international talent in the past 12 months for remote positions.
- Remote hiring gives a unique set of advantages, opening access to 340% larger candidate pools and 16% faster time-to-hire.
- Nearly 25% of employed women worked from home in April 2025, compared to about 19% of employed men who teleworked.
- Oregon is the best destination in the U.S. for the Remote Talent workforce, with around 10% of open roles classified as fully remote. States such as Mississippi, West Virginia, and South Carolina remain heavily office-based, with approximately 94% of roles requiring on-site presence.
- In Q4 2025, hybrid roles were most common in New York and Massachusetts (32%), followed by Minnesota (31%), Oregon (28%), and Colorado (27%).

Feel free to share this infographic! Just please credit us with a link. You can re-upload the image or copy the embed code below:
<a href="https://ataraxismgmt.com/global-outsourcing-remote-talent-statistics-tracker/"><img src="https://09932210.delivery.rocketcdn.me/wp-content/uploads/2026/03/Top-destinations-by-remote-talent-availability.png.webp" alt="Top destinations by remote talent availability" style="width: auto; height: auto; max-width: 100%; border: none;"></a><p>Source: <a href="https://ataraxismgmt.com/global-outsourcing-remote-talent-statistics-tracker/">Ataraxis Management Inc.</a></p>
Remote Work Trends 2026
- 90% of respondents felt as productive or more productive working from home.
- By 2025, 32.6 million Americans ( approx. 22% workforce) will work remotely.
- 98% of workers want remote work at least some of the time.
- 16% of companies operate fully remote.
Key Workplace Trends:
- Hybrid Work: 52% of remote-capable employees work hybrid; 2–3 office days/week.)
- 4-Day Work Week: ~2.7M UK workers by 2024.
- Flexible/Asynchronous Schedules: Outcome-based performance metrics replace fixed hours.
- Return-to-Office Policies: 34% required in-office 4+ days/week.
- Flexibility as Talent Strategy: 83% workers prefer hybrid/remote; 69% would accept a pay cut to maintain flexibility.
U.S. Job Offshoring & Hiring Efficiency
- 300,000 U.S. jobs are outsourced overseas annually.
- 68% of companies outsourcing do so primarily to reduce costs.
- U.S.-based employers expanded employment abroad faster than domestic hiring for 7 years.
- Local teams report ~22% higher project success rates than offshore teams.

Feel free to share this infographic! Just please credit us with a link. You can re-upload the image or copy the embed code below:
<a href="https://ataraxismgmt.com/global-outsourcing-remote-talent-statistics-tracker/"><img src="https://09932210.delivery.rocketcdn.me/wp-content/uploads/2026/03/Average-time-to-hire-by-region.png.webp" alt="Average time to hire by region" style="width: auto; height: auto; max-width: 100%; border: none;"></a><p>Source: <a href="https://ataraxismgmt.com/global-outsourcing-remote-talent-statistics-tracker/">Ataraxis Management Inc.</a></p>
Cost of a Bad Hire: U.S. vs Offshore
U.S. Hire:
- Average cost is $17,000 per employee; and up to $240,000 with senior roles
- Average replacement cost is almost $15,000.
Offshore Hire:
- Average cost is $7,000 per employee
- Average replacement cost is $8,000
Comparison Summary:
| Factor | U.S. Hire | Offshore Hire |
|---|---|---|
| Avg. bad hire cost | ~$17,000 | ~$2,000–$10,000 |
| Replacement cost | $15,000–$50,000 | $2,000–$7,000 |
| Salary baseline | High | Lower |
| Financial risk | Much higher | Lower |

Feel free to share this infographic! Just please credit us with a link. You can re-upload the image or copy the embed code below:
<a href="https://ataraxismgmt.com/global-outsourcing-remote-talent-statistics-tracker/"><img src="https://09932210.delivery.rocketcdn.me/wp-content/uploads/2026/03/Pros-of-hiring-an-offshore-workforce.png.webp" alt="Pros of hiring an offshore workforce" style="width: auto; height: auto; max-width: 100%; border: none;"></a><p>Source: <a href="https://ataraxismgmt.com/global-outsourcing-remote-talent-statistics-tracker/">Ataraxis Management Inc.</a></p>
Best Hiring Efficiency Destinations
Philippines, India, Chile, South Africa, Nigeria, Peru, Indonesia, Argentina, Kenya, Brazil
Source: Global Outsourcing Talent Index
Methodology
Data Sources:
- Public industry research, labor statistics, outsourcing market reports, and remote work surveys
- Government labor data & international salary benchmarks
- Aggregated Ataraxis client engagement data (anonymized & standardized)
- Platform-level operational metrics across managed offshore teams
Proprietary Ataraxis Data (Internal Data 2026):
- Hiring and placement data
- Compensation benchmarks across regions
- Time-to-hire tracking
- Productivity metrics from managed teams
- AI tool adoption rates
- Retention and churn data
Data Limitations:
- For informational purposes only
- Market conditions may change; exchange rates fluctuate
- Internal data reflects Ataraxis-managed engagements, not the entire market